New developments in deforestation remote sensing in the U.S.
 Cecilio Ricardo United States Department of Agriculture Forest Service. Public Domain Mark 1.0 No Copyright
 By combining old deforestation survey methods, U.S. Geological Survey researchers have developed a new large-scale representation which increases efficiency and accuracy. The hope for the future is real-time mapping
by Matteo Cavallito
A group of U.S. researchers has developed a new system for remote sensing of deforestation on large geographic and temporal scales. The operation, carried out by scientists at the U.S. Geological Survey Earth Resources Observation and Science (EROS) Center in Sioux Falls, South Dakota, was based on overcoming previous approaches by allowing for “more accurate land cover mapping and updating,” as Suming Jin, one of the researchers involved, said in a statement.
The study, published in the Journal of Remote Sensing, highlights a new system that combines the strengths of older methods while improving the efficiency, flexibility and accuracy of operational mapping of large areas. This technique, the release continues, “facilitates more effective forest management and policy, among other applications.”
Overcoming old methods
Based on data from the National Land Cover Database, the remote sensing archive of the U.S. Geological Survey, scientists observed how between 2001 and 2016 nearly half of the land cover changes in the United States involved forested areas.
The research comes from combining two different analysis systems: the “2-date forest change detection method“, which involves comparing images from two different times, and the so-called “time series algorithm“, which provides observations for annual or monthly time series.
Both systems have some limitations. For example, the two-date method requires additional information or new processing to separate forest changes from land cover changes. Time-series-based forest change detection algorithms require continuous monitoring updates with the risk of generating inconsistencies.
The new system
Thus, the research team realized a new processing system called “Time-Series method Using Normalized Spectral Distance (NSD) index (TSUN)”. The result is the 1986-2019 data collection and representation system that shows the trend of forest alterations for a longer period with an interval of two or three years.
To simplify: the method is divided into four sections in which some modifications are made to the starting techniques.
In the first part, the two-date method is operated on, thus obtaining a more accurate result in describing the increase or decrease in biomass. In the second, the time series method is also operated on while in the third section the results obtained are combined. Finally, in the fourth section, the results together with auxiliary data are expanded and refined to produce the final map of the phenomenon over the period under consideration.
The ultimate goal: monitoring deforestation in real time
In the United States, the issue of forest area alteration has long been on the radar of scientists. Last year, a study led by the University of Maryland found that in just 150 years the American Midwest has lost the entire amount of additional biomass accumulated over the previous 8 millennia. The development of more accurate and up-to-date survey methods will in time allow for more timely data and answers by effectively monitoring deforestation.
Researchers at the U.S. Geological Survey, in particular, plan to improve the tool to date by increasing the temporal frequency so that data can be provided on an annual scale.
“The TSUN index detects multi-date forest land cover changes and was shown to be easily extended to a new date even when new images were processed in a different way than previous date images,” Jin said. “Our ultimate goal is to automatically produce forest disturbance maps with high accuracy with the capability of continually monitoring forest disturbance, hopefully in real-time.”
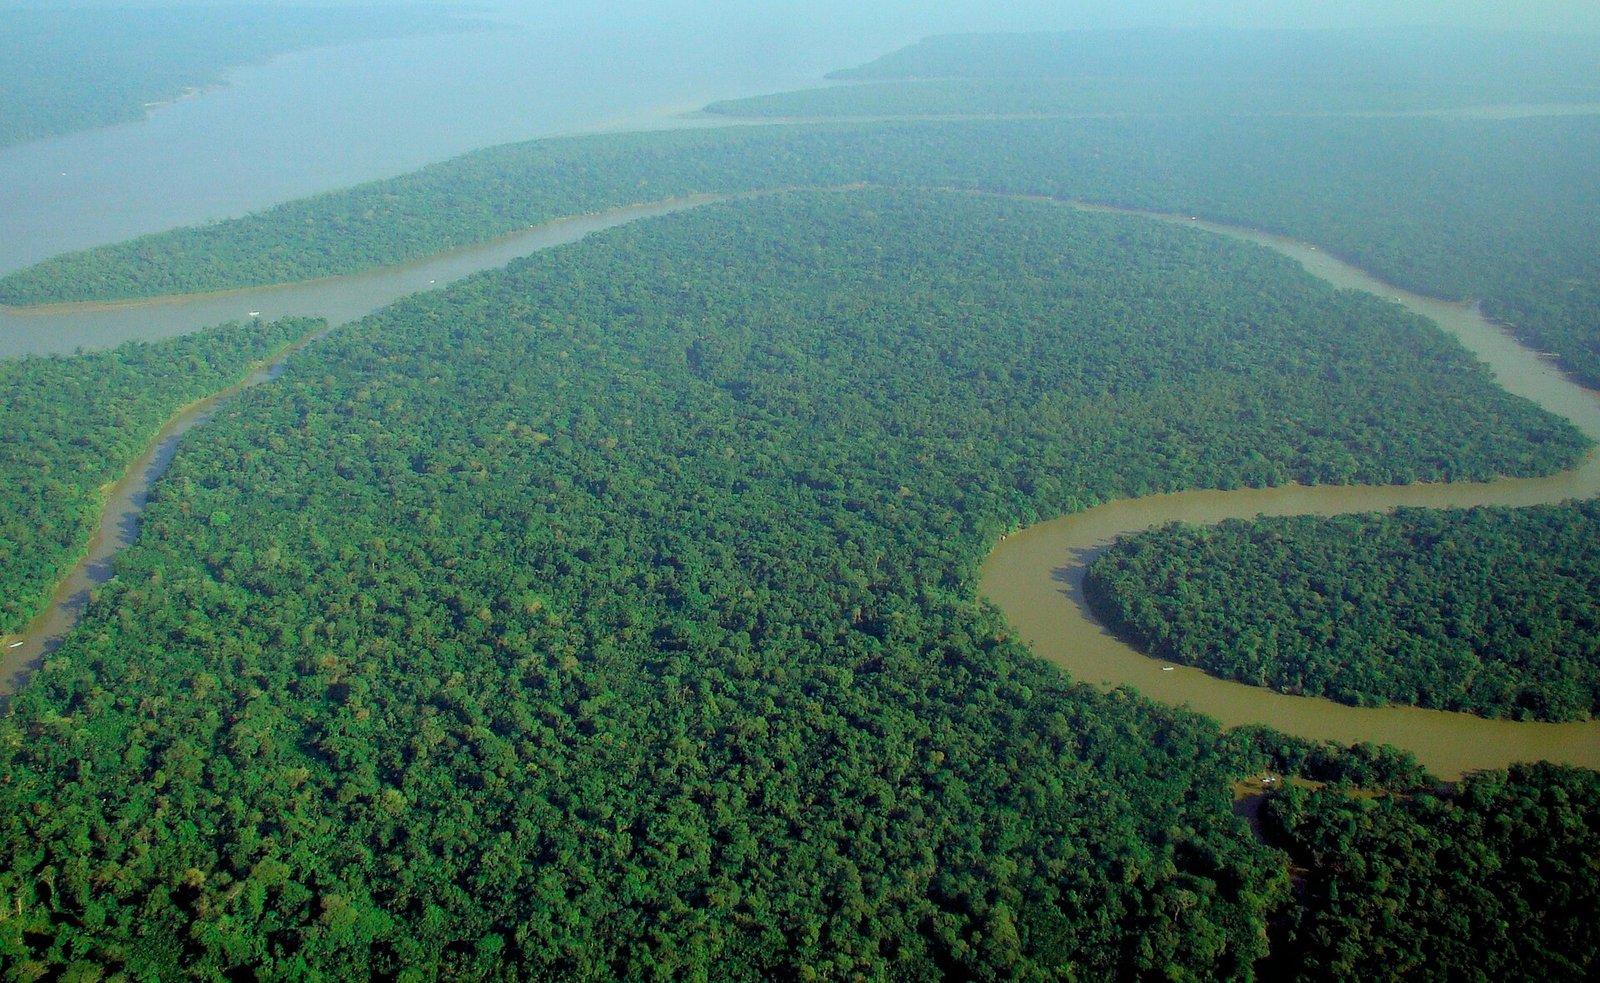 Photo: lubasi, Creative Commons Attribution-ShareAlike 2.0 (CC BY-SA 2.0)
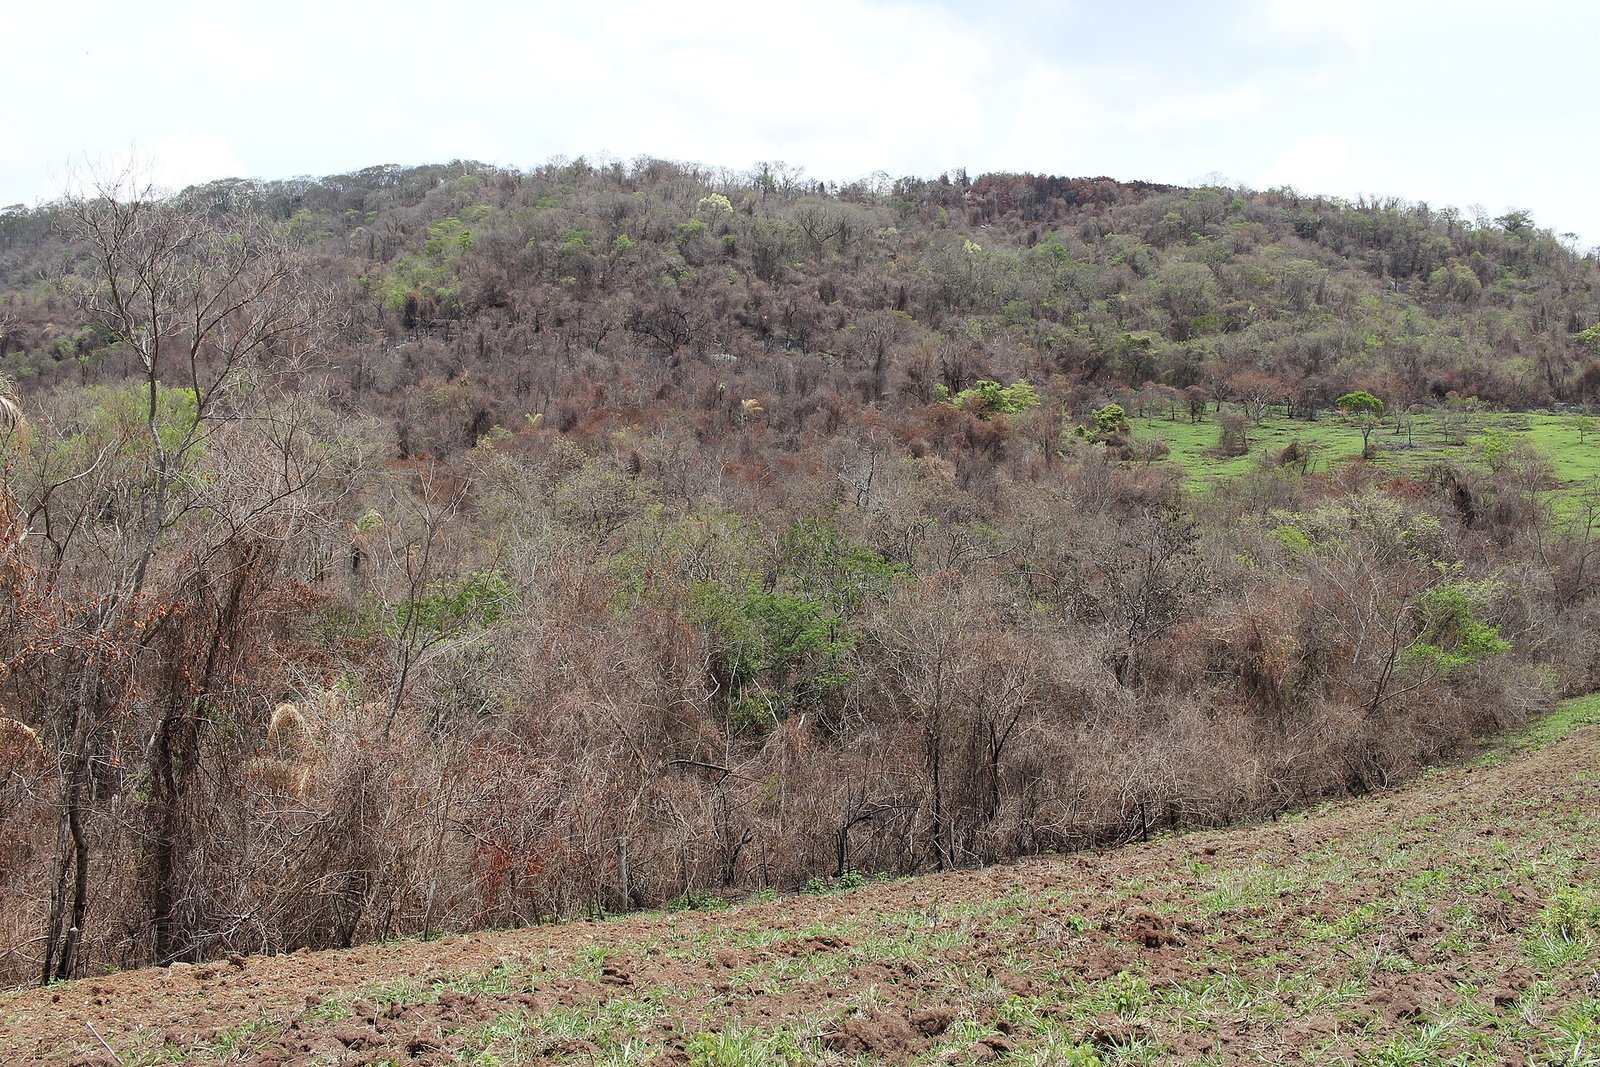 Thyrome, CC BY 4.0.
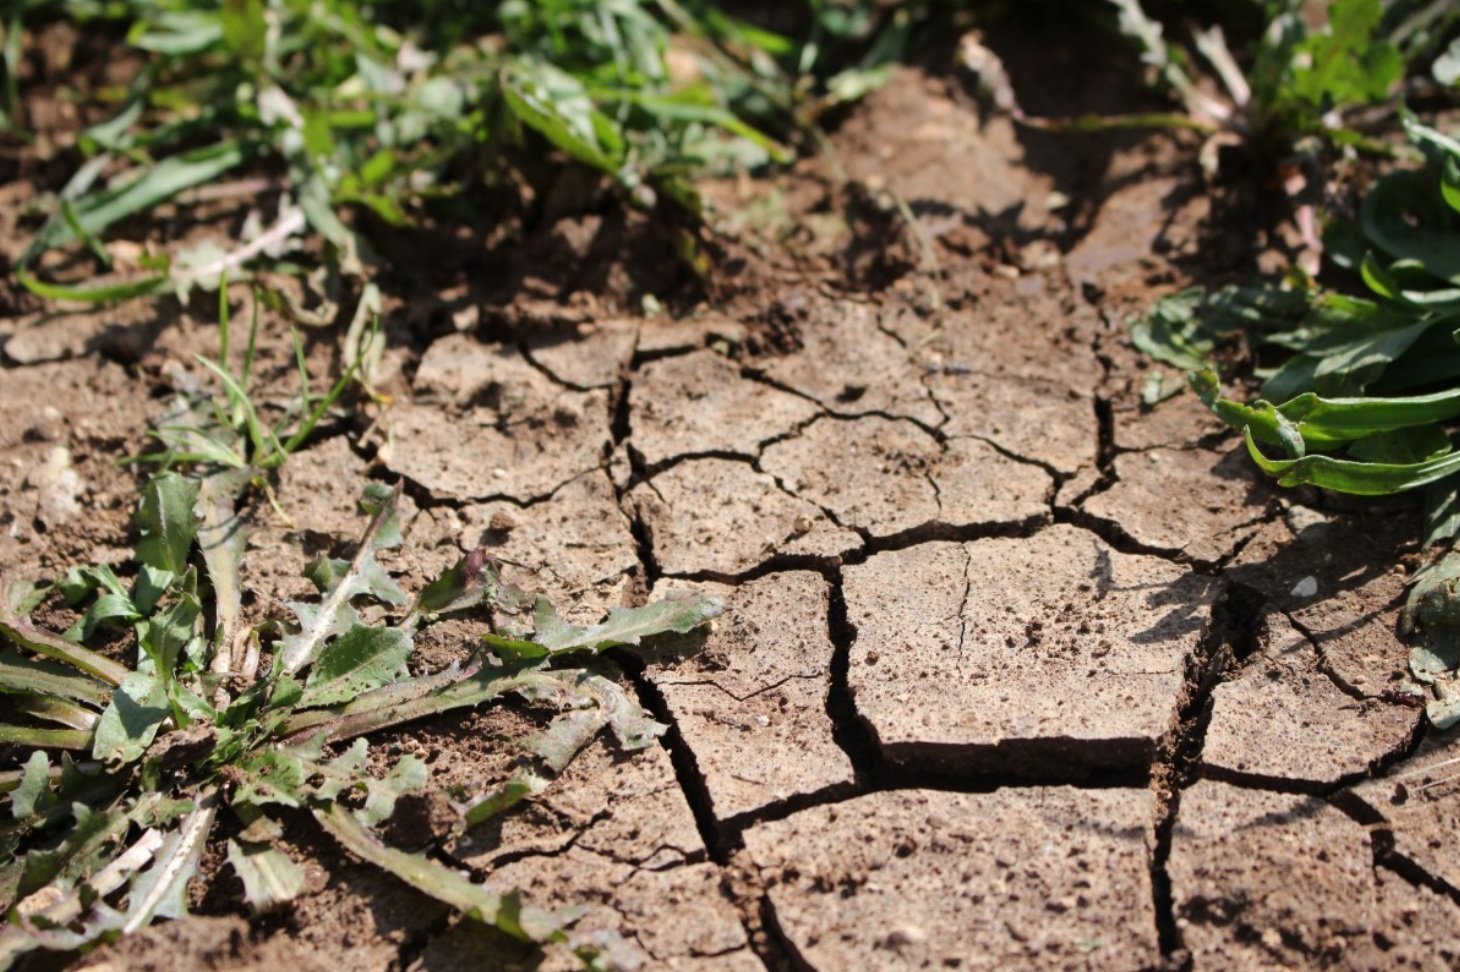 pxhere, CC0 Public Domain. Free for personal and commercial use. No attribution required