Measuring global soil moisture is more difficult than expected
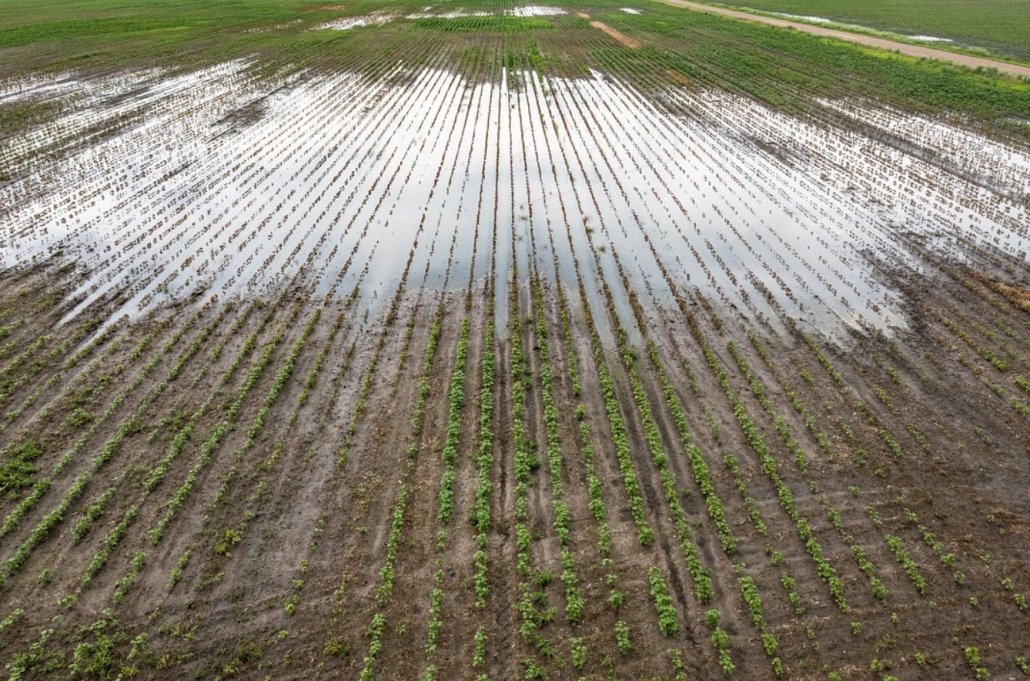 U.S. Department of Agriculture (USDA) CC0 1.0 Universal CC0 1.0 Deed
 A Chinese study has proposed a new double validation method to compare humidity data from nearly a thousand stations. Highlighting and solving typical spatial representativeness errors
by Matteo Cavallito
Soil moisture is a key indicator for understanding and predicting the dynamics affecting land and the environment. Measuring its level correctly is therefore essential for aspects such as disaster management and agricultural planning. However, the proliferation of data collected by satellites, land surface models, and other analysis systems would produce contradictory signals about moisture and drought trends. This is especially true in arid regions where water resources are scarce.
This is according to a study by the Xinjiang Institute of Ecology and Geography published in the journal Science Bulletin. In particular, the authors emphasized the importance of selecting appropriate data. Thus highlighting common errors and outlining long-term trends.
Monitoring systems
Modern soil moisture monitoring systems are based on three complementary approaches: ground sensors, which are accurate but not very representative due to the high heterogeneity of the soil; the International Soil Moisture Network (ISMN), which has been collecting data from around 80 global networks since 2010; and finally drones, which should ideally be positioned ‘in between’, bridging the gap between the two systems. However, the research notes that, while acting as a link between in situ and satellite measurements, they are limited by several factors such as flight autonomy and regulatory restrictions.
Alongside these three approaches are three strategies for obtaining global estimates: land surface models (LSMs), reanalysis products, and microwave remote sensing.
LSMs simulate soil hydrological processes across multiple layers, while reanalyses combine observations and models to ensure spatiotemporal continuity. Microwave satellites provide frequent data on surface moisture. However, all these systems have technical and application limitations. Studies have been conducted to analyze the consistency and performance of global datasets. But their validation has been limited to individual regions, ecosystems, or short periods. The Chinese study therefore aims to overcome the various limitations that have emerged.
The study
“Multi-source datasets show spatiotemporal inconsistencies and uncertain regional applicability due to algorithmic and observational limitations,” explains the research. This results in three main challenges: understanding discrepancies in long-term trends between data sets, expanding global multi-climate and multi-ecosystem comparisons, and clarifying sources of error in complex environments. The study addresses these critical issues by systematically evaluating 23 global soil moisture datasets over a very long period: 1980–2023.
It does so, says a statement, by implementing “an innovative dual-validation framework, comparing data from 992 stations in the International Soil Moisture Network and a filtered subset of 483 highly representative stations to quantify the impact of spatial heterogeneity.”
The results revealed sharply divergent trends in global soil moisture dynamics. “While a slight drying trend dominated the long-term period (1980–2023),” the study says, “a significant number of datasets indicated a shift towards wetting after 2010.”
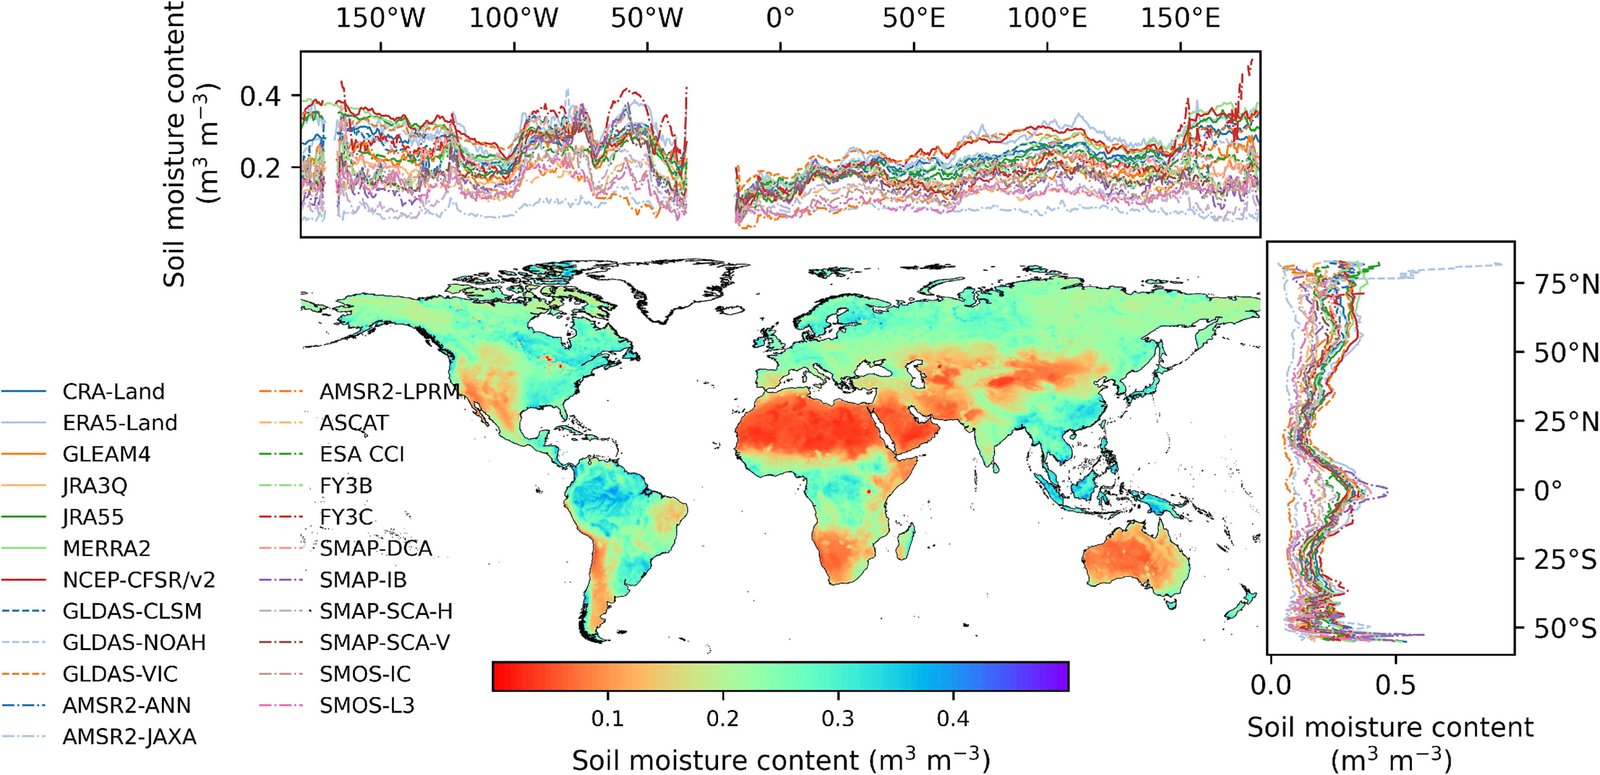
Global distribution of the average annual surface soil moisture content derived from 23 data sets (1980–2023) and corresponding area-weighted annual averages. Source: Ziyang Zhu et al., “Global soil moisture dynamics since 1980: datasets biases, trends, and science-informed selection”, Science Bulletin, 2025, ISSN 2095-9273, Attribution 4.0 International CC BY 4.0 Deed
Moisture data are consistent with geography
The system used produced consistent data. Among the various datasets analyzed, the highest values for the annual average soil moisture content are concentrated in equatorial regions, coastal areas, near lakes, and in rainforests, where rainfall is more frequent. Arid regions and some high-altitude areas, on the other hand, have low moisture content. Which is associated with low rainfall and high evaporation.
Areas with high values mainly coincide with tropical forests and humid regions at high latitudes in the northern hemisphere.
Here, “the elevated moisture levels in these regions are closely linked to abundant precipitation, low evaporation, and in the case of the northern zones, the presence of permafrost , which remains (nearly) saturated all year round.” The lowest values are found in arid and continental climates, while semi-humid regions at mid-latitudes show strong spatial variability. This is due to seasonal rainfall, human activity, and differences in soil types.
Beware of errors
In addition to defining the general trend, the study makes an important contribution by highlighting one of the most common mistakes that can arise in measurements. That is the spatial representativeness error. This, they explain, is the “discrepancy between a single spot measured on the ground and the vast area observed by satellites (that) can inaccurately mask the true quality of the data.”
By reducing the heterogeneity of land cover at validation sites, they continue, performance metrics can improve significantly.
In general, the study highlights the need to apply new-generation models and products based on different indicators and capable of adapting to the climate and ecosystem context. “Our analysis shows that there is no one-size-fits-all approach to data selection,” said Zhu Ziyang, lead author of the study. “By comparing the strengths and weaknesses of different data products, we can significantly enhance the reliability of our research.”
 Thpelin Attribution-ShareAlike 3.0 Unported CC BY-SA 3.0 Deed
 Jonathan Wilkins Attribution-ShareAlike 3.0 Unported CC BY-SA 3.0 Deed