US agriculture pays the price of atmosphere “thirst”
 USDA photo by Bob Nichols. Attribution 2.0 Generic CC BY 2.0 Deed.
 An American study introduces the concept of “thirstwaves.” In the US they have been on the rise for at least four decades. The phenomenon occurs when evaporative demand is high and plants therefore need more water
by Matteo Cavallito
Heat waves impact plant and soil conditions by forcing farmers to carefully manage water resources. But such a concept, some scientists now suggest, may be overly unbalanced with the risk of not fully capturing the true weight of all the factors involved. To overcome this problem, therefore, we need to look to a different dimension that can be described by a new term: thirstwaves.
These are “a very powerful metric as well as a crucial distinction with respect to heat waves,” says in a news release Mike Hobbins, researcher, researcher at NOAA Physical Sciences Laboratory in Boulder, Colorado. “For decades”, he says, this phenomenon has led us to think “that temperature is really the only dimension to look at for information.” Whereas the reality is definitely more complex.
A bridge between many disciplines
The concept of a thirstwave was first introduced in a study published in March in the journal Earth’s Future. Its authors, Hobbins and colleague Meetpal Kukal of the University of Idaho, define it as the result of “at least three consecutive days when daily evaporative demand was greater than its historical 90th percentile value for that period.” That is, when the value exceeds 90 percent or more of all historical values measured over time.
“Evaporative demand of the atmosphere serves as a critical link between many disciplines including but not limited to hydrology, climate science, biometeorology, plant physiology, and agronomy,” the study explains.
When demand goes up, plants need more water
The concept, in particular, measures the ability of the atmosphere to demand water given the theoretical absence of water availability limits. The term, in short, indicates the potential for evaporation and transpiration from the soil and is an essential indicator of the “water need” of crops. When evaporative demand is high, in other words, the atmosphere is very thirsty. That is, plants need more water to continue to be productive. A condition that, at least in the United States, seems to be occurring more frequently over time.
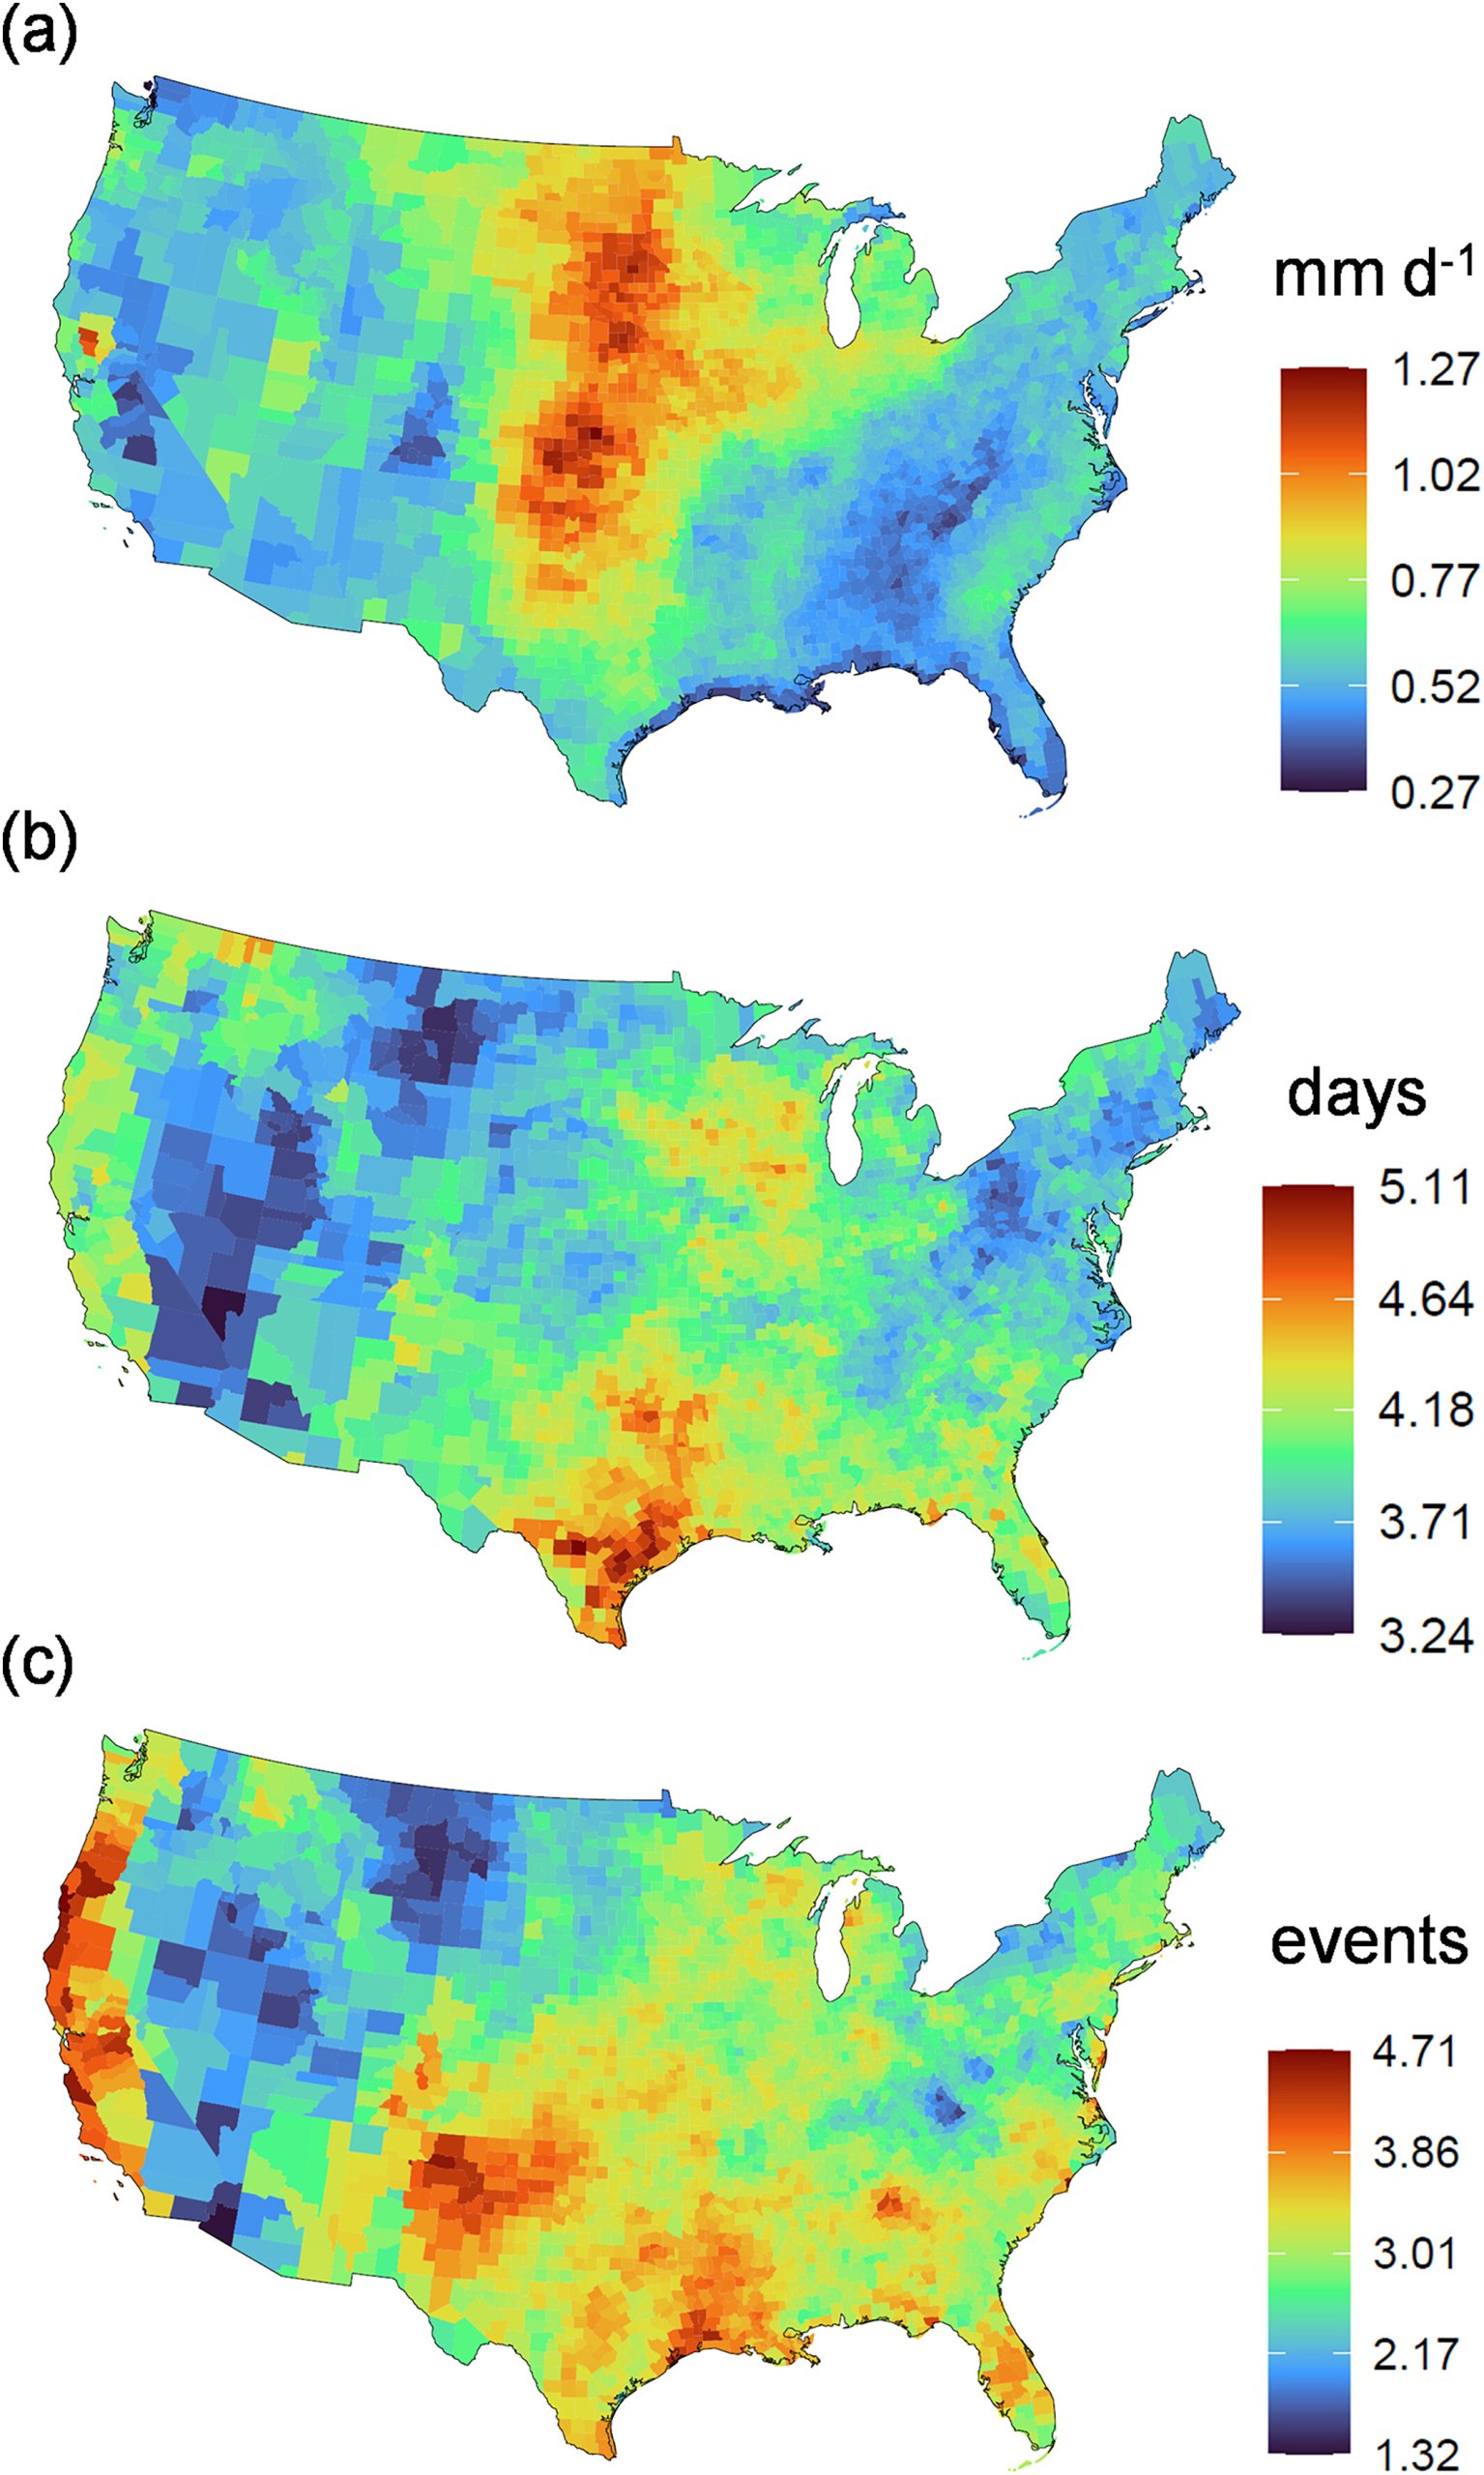
(a) Long-term mean county-level thirstwave intensity, (b) duration, and (c) frequency over the period 1981–2021. Thirstwaves have relatively lasted longer (i.e., duration) on average (>4.5 days) in parts of Southern US Upper Midwest, west coast, and the Pacific Northwest. The west coast, and the Southern US have had relatively greater number of thirstwaves than the national average. Source: Kukal, M. S., & Hobbins, M. (2025).Thirstwaves: Prolonged periods ofagricultural exposure to extremeatmospheric evaporative demand forwater. Earth’s Future, 13,e2024EF004870. https://doi.org/10.1029/2024EF004870Received 8 MAY 2024 Attribution 4.0 International CC BY 4.0 Deed
[/caption]
Thirst on the rise for 40 years
The study examined thirst waves in the continental United States from 1980 to 2021, quantifying their intensity, duration and frequency. The scientists found that such waves have become 17 percent more intense and 23 percent more frequent over the past four decades. Moreover, the authors explain, “Over time, all aspects of these thirstwaves have gotten worse. It has also become much less likely that a growing season will pass without any thirstwaves.”
The results, in detail, show how the waves had an intensity of 0.8 millimeters per day, an average duration of 4 days and a frequency of 2.9 events per growing season.
“Thirstwave intensity is relatively greater (>1 mm d−1) in the High Plains region,” the researchers explain. “Thirstwaves have relatively lasted longer (i.e., duration) on average (>4.5 days) in parts of Southern US Upper Midwest, west coast, and the Pacific Northwest. The west coast, and the Southern US have had relatively greater number (>3.5 events) of thirstwaves (i.e., frequency) than the national average.” The year 2012 was the most severe due to the severe impact of drought.
A new tool for farmers
Compared to heat waves, the concept of thirstwaves takes into account important factors such as moisture, wind and solar radiation and, therefore, appears more useful in providing essential guidance to farmers called upon to assess soil water requirements. Expecially in light of the historical trend that emerged in the study. Farmers have always considered the average evaporative demand values of their region to determine how much water their crops will need.
The research, however, showed that thirst waves occur more often in areas with lower average evaporative demand, such as the Midwest, rather than in traditionally dry areas, such as the Southwest.
Finally, the results “make us think about how our current water resources infrastructure, irrigation equipment, and water management should mitigate and adapt,” explains Kukal. Moreover, “As these pressures grow, there’s less and less room for guesswork in irrigation, so if you are under limited water conditions, you’ve got to do a better job at really tracking your water.”
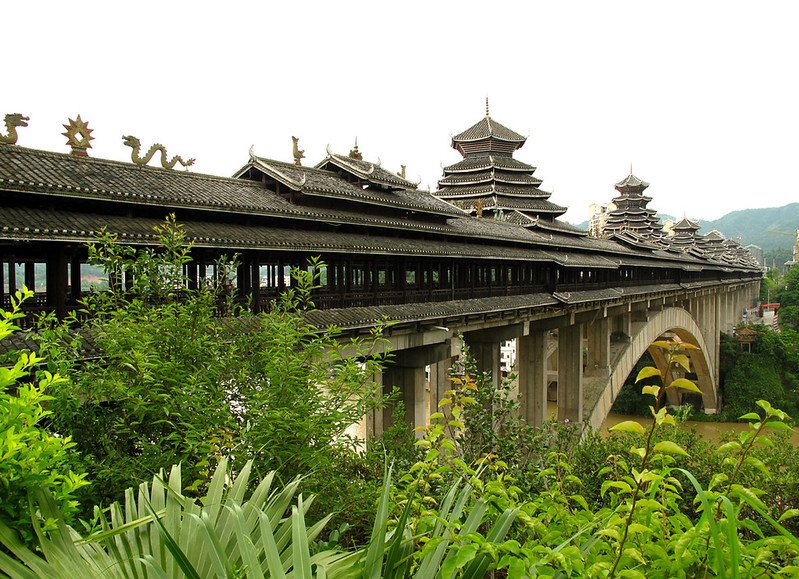 Rutger van der Maar, CC BY 2.0.
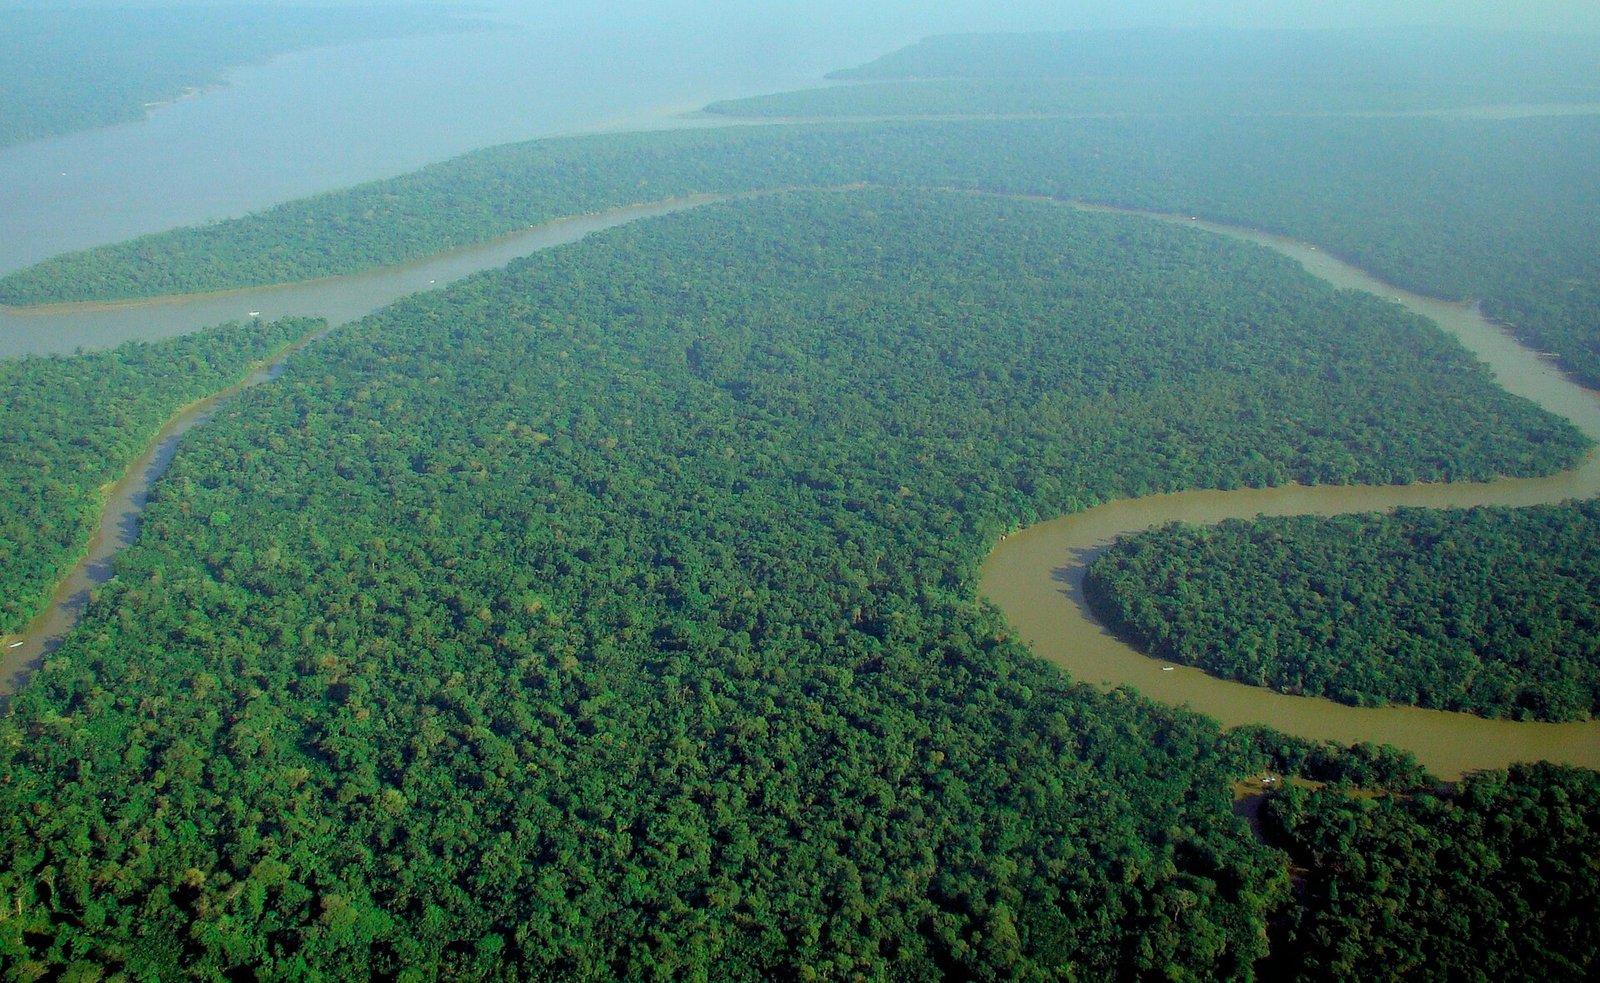 Photo: lubasi, Creative Commons Attribution-ShareAlike 2.0 (CC BY-SA 2.0)
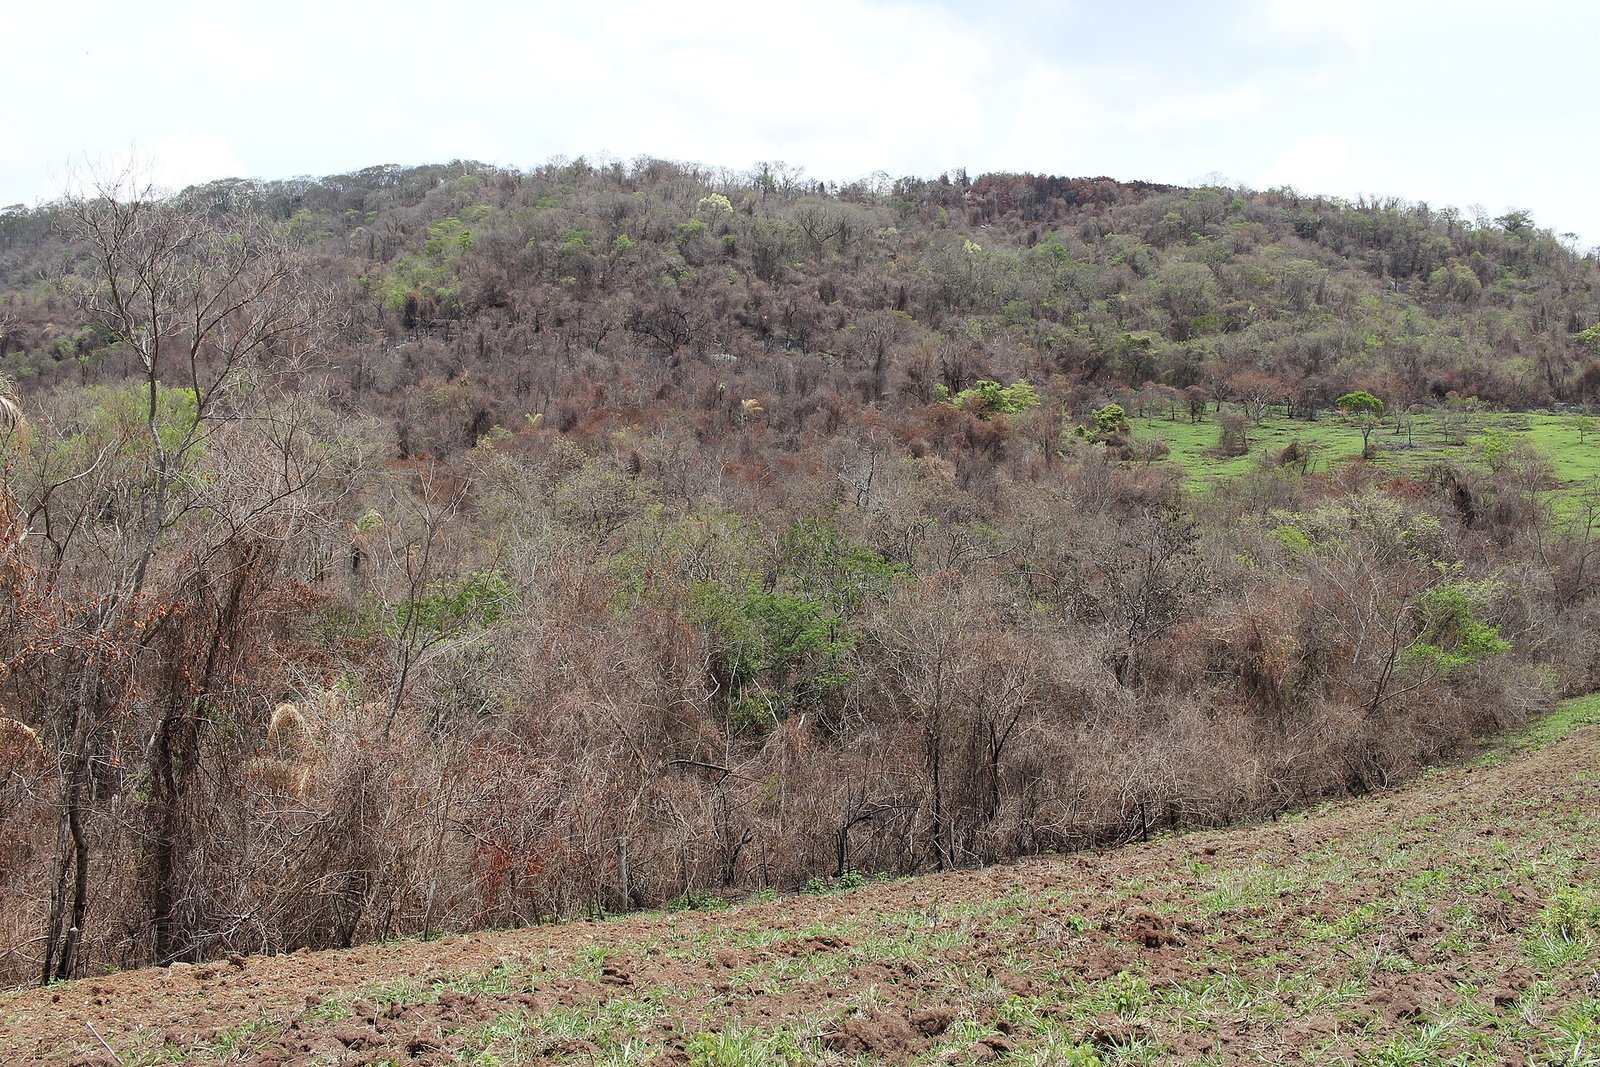 Thyrome, CC BY 4.0.